

 August 3, 2026
Consumer goods companies have spent the past few years trimming their product catalogs. The logic is easy to follow. Fewer SKUs means simpler production runs, cleaner shelves, fewer forecasts to miss, and less working capital tied up in slow movers.
Research from Bain & Company complicates that picture in a way worth sitting with. Bain’s work on portfolio simplification argues that most consumer goods companies simplify on instinct by cutting the under-performing SKUs, and that there is a fundamental flaw in that thinking: it does not generate growth. Trimming the tail lowers cost. Whether it lowers cost enough to matter, and whether the freed capacity gets pointed at something better, is a separate question. The interesting distinction is not between more products and fewer products. It’s between variety that drives profit and variety that only adds cost and complexity. MetricsCart
General Mills is not in the news for cutting SKUs, but its portfolio makes a useful illustration. The company sells Cheerios, Yoplait, Nature Valley, Pillsbury, Betty Crocker, and dozens of other brands across cereal, yogurt, snacks, and baking. Those products do not contribute equally to profit. Some are high-contribution-margin anchors. Others earn less per unit but bring shoppers down the aisle in the first place, and a few are probably adding complexity without earning their shelf space.
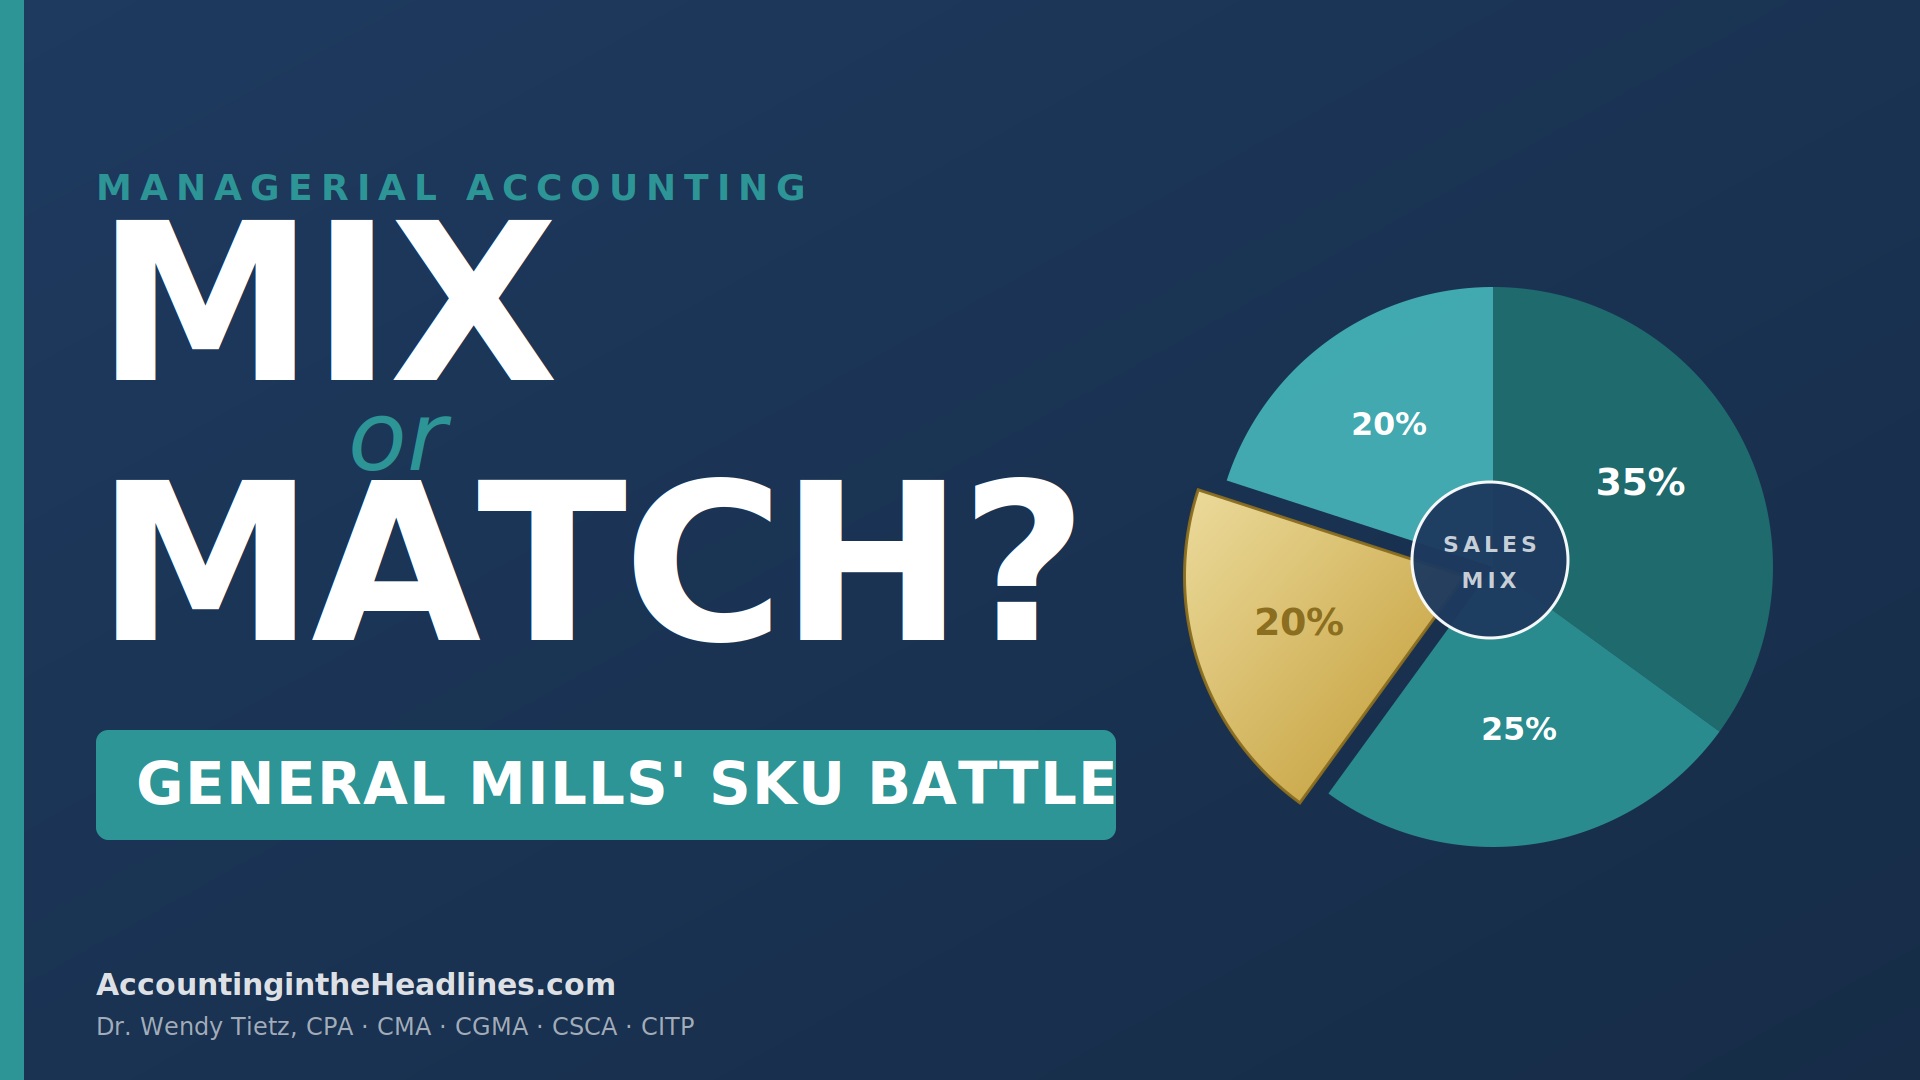
Sales mix analysis is the managerial accounting tool for thinking through these trade-offs. Sales mix refers to the relative proportions in which a company’s different products are sold. When a company sells multiple products with different contribution margins, its overall profitability depends not just on how much it sells, but on what it sells. The weighted average contribution margin, calculated by multiplying each product’s contribution margin by its share of the sales mix and summing the results, links sales mix directly to break-even analysis and operating income.
View a quick tutorial video about sales mix analysis at this [link] and then answer the following questions.
Note to instructors: This post is assignable in Pearson’s MyLab and has questions that are auto-graded.
Discussion Questions
1. What is sales mix, and why might a change in a company’s sales mix affect its overall profitability even when total unit sales stay exactly the same?
2. How does the weighted average contribution margin depend on both the individual product contribution margins and the relative proportions of each product sold?
3. If General Mills deliberately shifted its sales mix toward higher-contribution-margin products, like premium yogurt brands, and away from lower-margin basic cereals, what would you expect to happen to its break-even point and its operating income at a given level of unit sales?
4. Question 3 assumes the shift works as intended. Beyond contribution margin, what could cause a deliberate shift toward higher-margin brands to backfire for General Mills?
5. Industry commentary often distinguishes between “good complexity” and “bad complexity” in a product portfolio. How could sales mix analysis, combined with data on each SKU’s costs and revenue, help a company like General Mills tell the two apart?


No comments yet... Be the first to leave a reply!